Table of Contents
In this post, You will get knowledge about the Pareto chart analysis template. “Pareto Chart” The business world is very unpredictable; there are so many external and internal factors that hold a huge impact on a certain business and the company it is associated with. These factors in a lot of cases are problems that cause disadvantages to the company. They may affect everyone involved, from the lower tier to the top tier. They have to be tackled as soon as possible.
But the thing about these problems is, they can only be taken on and fixed by the one in charge. For those who are in charge, there are a lot of very significant decisions to be made that can influence the future of their business. But as I stated before. The business world is highly unpredictable, the unpredictability gives rise to so many problems which bring us to this question; which problem should be addressed and fixed first?
That is where Pareto Chart Analysis and the chart associated with it come in.
What is Pareto Analysis?
To make a sound decision into figuring out which problem should be addressed first, leaders and company executives do a Pareto analysis.
A Pareto analysis, also known as the 80/20 rule, is basically a technique that helps someone decide the order in which they have to prioritize their decisions. Those prioritized decisions will have an influence on their goals with respect to their companies.
You might be wondering why the Pareto analysis is called the 80/20 rule. The reason is pretty simple, the Pareto analysis is based on the idea that 80% of a company’s problems are because of only 20% of the causes.
The 80/20 idea is actually very vast; it can be applied in almost every business-related situation. Some of them are.
- 20% of the customers can bring in 80% of the revenue.
- 20% of your products account for 80% of the profit.
- 80% of your problems have 20% of the causes,
- 20% of your employees produce 80% of your products.
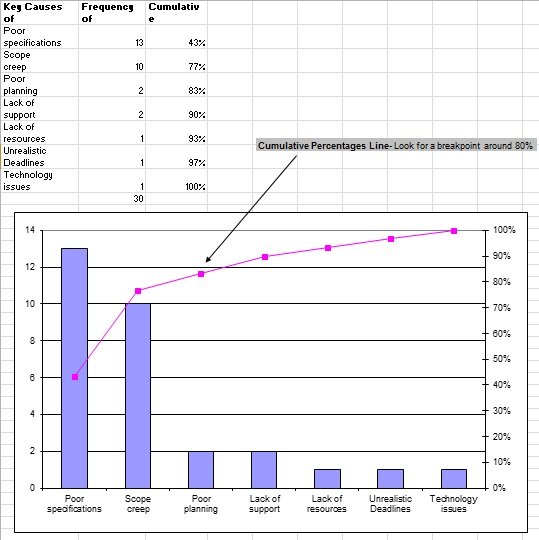
Clearly from the above demonstration, we can safely say that the 80/20 rule can be applied on anything and the Pareto Analysis can be done without much problem also find the Pareto Chart Excel template.
How the Pareto Analysis is done
Following is a detailed step by step process of the Pareto analysis:
Step 1: List down all the problems your company is facing.
Step 2: List down all the potential causes that give rise to the problems written in the above step.
Step 3: Weigh down the problems. What this means is that you score down the problems you have listed on the basis of the degree of their intensity.
Step 4: Group the problems on the basis of the cause. If they have a common cause or even a slightly similar one, you group them together.
Step 5: Start going through the problems one by one according to the total score they have. you may also like White Paper Analysis.
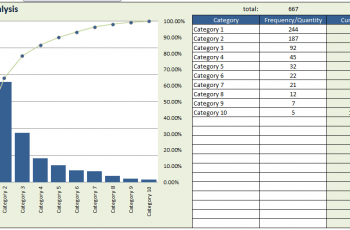
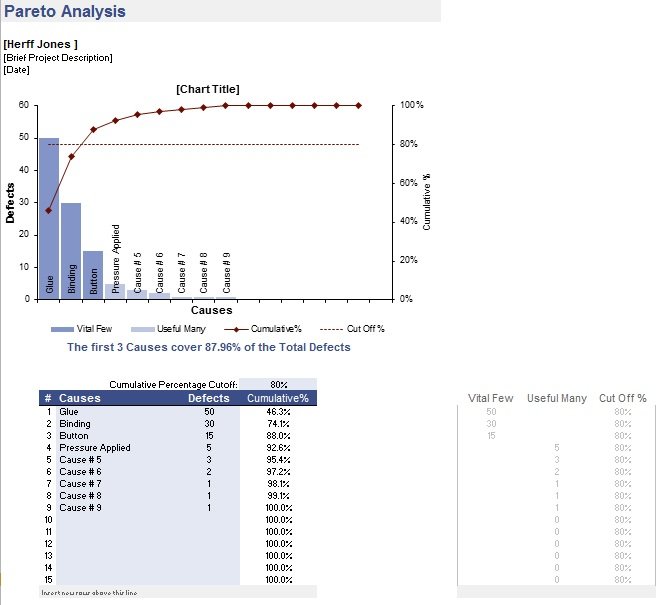
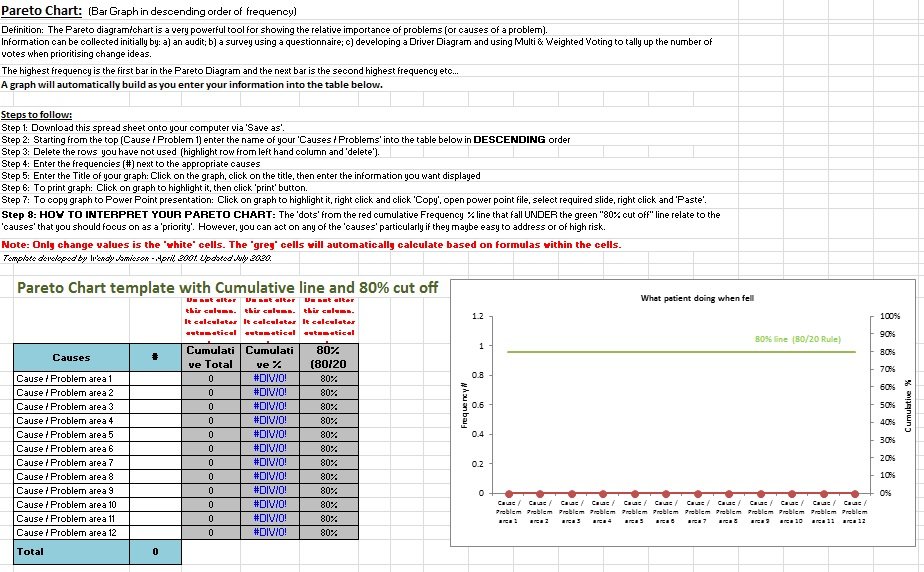
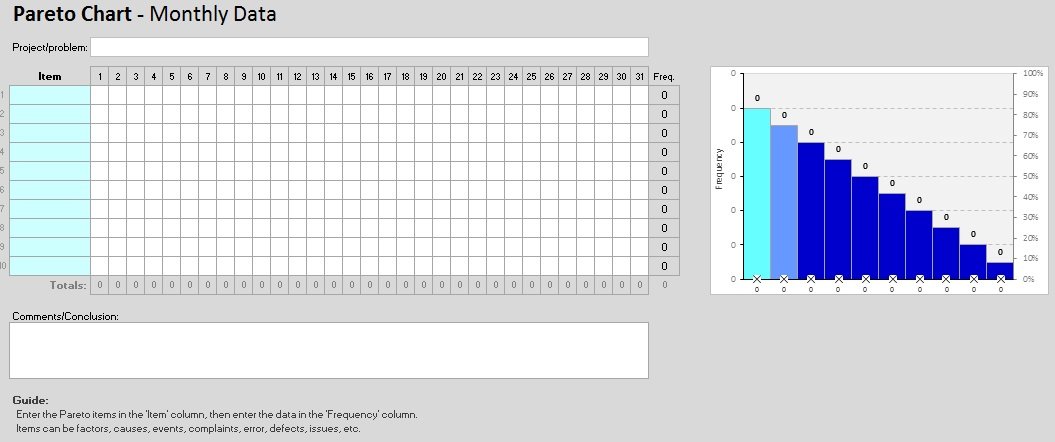
What this Particular Microsoft Excel Template offers
Though the Pareto Analysis is simple, it is very comprehensive; to make that easy for you we have this Microsoft Excel Template. It has all the aspects that allow you to easily do the Pareto analysis without taking up too much of your time.

